Evening Star Pattern: Definition, Meaning, and Example Chart
In the ever-shifting tides of stock markets, where success hinges on astute analysis and timely decision-making, candlestick patterns are an instrumental financial tool for traders and analysts alike.
Among these, the evening star pattern stands out as a powerful visual cue for potential trend reversals in the market. Comprising three distinctive candlesticks, this chart pattern takes shape amidst an established price uptrend, signaling a pivotal shift in market sentiment.
This comprehensive guide will take you through the evening star candlestick pattern, exploring its formation, significance, and practical trading tips.
What Is an Evening Star?
The evening star pattern is a three-candle pattern that technical analysts use to analyze stock price charts. It is a bearish signal and suggests a potential trend reversal from bullish to bearish. In other words, an evening star candlestick pattern reflects a shift in sentiment from buying to selling, and traders interpret it as an opportunity to sell or take short positions.
Evening star candle patterns are associated with the top of a stock price uptrend, indicating that the uptrend is nearing its end, laying the foundation for the downtrend. Traders often use trendlines and price oscillators to identify it accurately and confirm whether an evening star pattern has occurred.
How an Evening Star Works
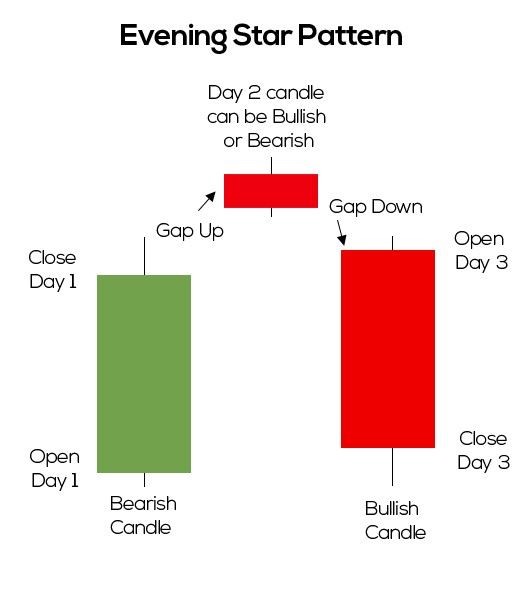
The evening star pattern forms over three days. Here is the breakdown of how it unfolds:
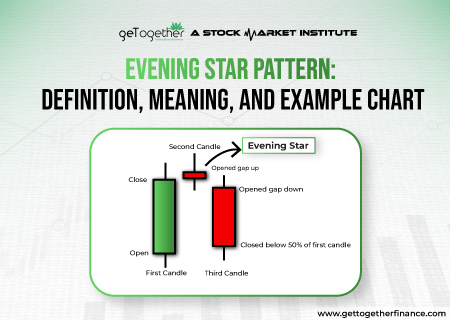
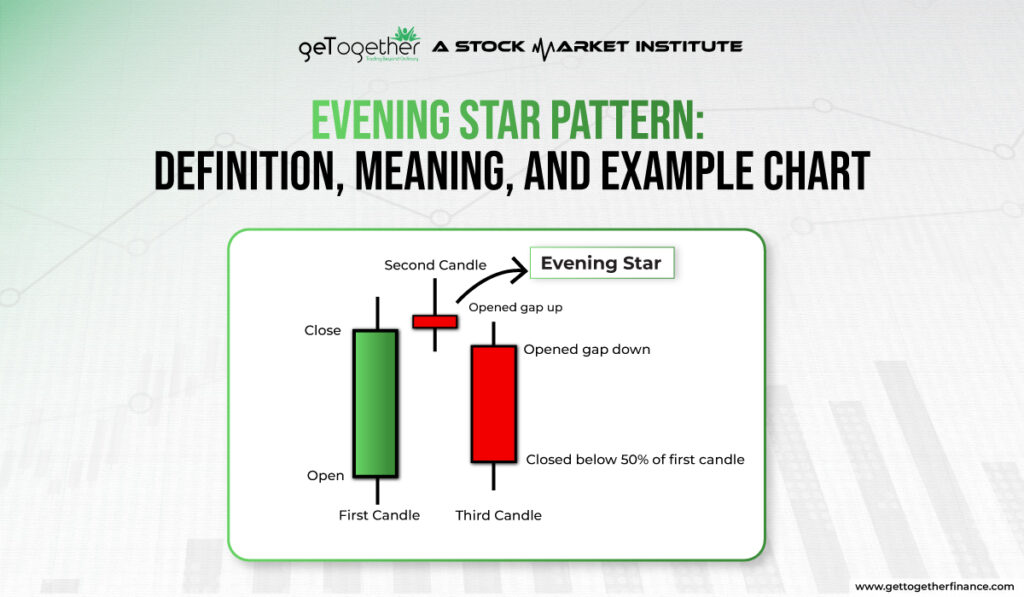
First Candle (Day 1 – Bullish Candle)
The pattern starts with a well-established uptrend, signifying that buyers are in control of the stock market. On the first day, a large bullish candle forms, representing consistent buying pressure. This candle indicates the optimism and strength of the bulls.
Second Candle (Day 2 – Doji or Small Body)
The second day introduces uncertainty in the market. This is represented by a small-bodied candle, a Doji, or a candle with an opening and closing price significantly close to each other. This second candle is the “star.”
The small body or Doji signals that the purchasing momentum from the first day is slowing down. It reflects a potential shift in sentiment, as neither buyers nor sellers are dominating the bourses on this day.
An ideal evening star candlestick pattern is characterized by a gap up from the first candle to the star. It means that the opening price surged swiftly from the preceding closing price, with very few or even no trades happening in between.
Third Candle (Day 3 – Bearish Candle)
The third day completes the pattern with a large bearish candle, indicating a strong shift in sentiment. Usually, with a gap down from the preceding star, this candle opens lower than the previous day’s close and closes well into the first day’s bullish candle.
The large bearish candle suggests that sellers have gained control, overpowering the purchasing pressure seen in the previous days. This change in momentum is a bearish reversal signal, confirming the evening star pattern and giving a sell call.
Furthermore, the shadow or wick is the lines above and below a candle body and represents the highest and lowest stock prices during a specific period. A longer shadow suggests greater price volatility, and vice versa. While identifying an evening star candlestick pattern, analysts and traders focus more on the open and close prices instead of the trading range of that session.
How To Identify An Evening Star Pattern
To identify an evening star candle pattern, you should observe the characteristics of three consecutive candlesticks on a stock price chart. Here is a step-by-step guide on how you can recognize the three-legged pattern:
Locate the Uptrend
Start by analyzing the overall trend of the stock’s price movement. The evening star pattern usually forms during an established uptrend. As such, look for a series of highs or higher lows (green) on the stock price chart, indicating a bullish market.
Find the First Candle
Look for a large bullish candle (green) with a long, hollow body representing strong purchasing pressure. This candle confirms the existing price uptrend. The open and close prices should have a notable gap, representing a significant price increase.
Identify the Second Candle
Following the large bullish candle, you should see a Doji or small-bodied candlestick. This candle’s closing price should ideally be within the range of the first candle’s body, indicating indecision and weakening buying pressure.
Confirm the Bearish Reversal
Finally, look for a strong bearish candle (red) closing considerably below the second candle’s low. This candle should have a long, filled body, emphasizing the selling pressure and confirming the trend reversal.
How to Trade Evening Star Patterns with Examples
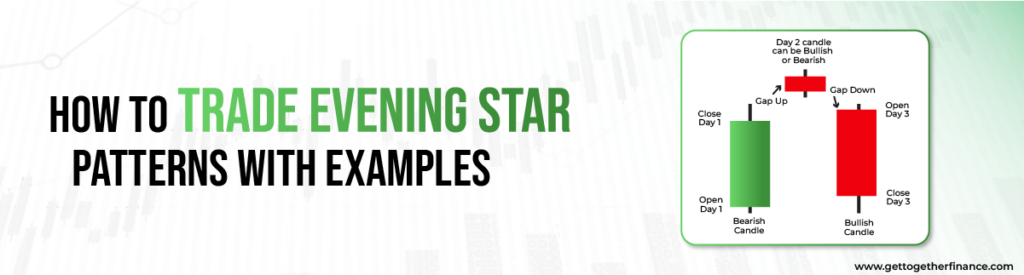
Follow these steps to trade stocks using an evening star pattern:
- Confirmation entry: Wait for the bearish candle (third candle) to close before entering a short position. Higher volume lends additional credibility to the potential trend reversal. This confirmation minimizes false signals and increases confidence in the downtrend.
- Entry point: Enter short positions after the third candle closes or a confirmation signal from another indicator, looking for targets at previous support levels or defined risk-reward ratios.
- Stop-loss orders: Place a stop-loss order above the high of the evening Doji candle (Day 2) to limit potential losses if the pattern fails.
- Take-profit levels: Set take-profit targets based on support levels or the extent of the expected price reversal. Fibonacci retracement levels and prior swing lows can act as potential profit-taking points.
This example shows a clear evening star pattern followed by a significant downtrend. The high volume on the bearish candle confirms the selling pressure.
Additional Tips for Accurate Identification:
- Look for volume confirmation. Ideally, the volume should be lower on the first candle (strong buying) and higher on the third candle (strong selling). This supports the pattern’s validity.
- Consider the location of the pattern. Ideally, it should appear near a resistance level or after a sustained uptrend, increasing its potential reliability.
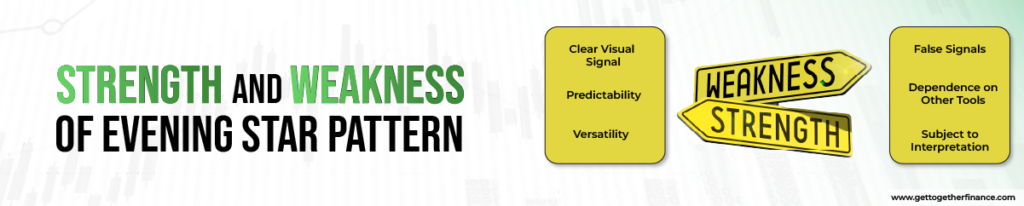
Strength and Weakness of Evening Star Pattern
The evening star candlestick pattern has both strengths and weaknesses that you must carefully consider when including it in your decision-making.
Strengths
- Clear Visual Signal: The pattern’s three-candle structure offers a clear and visually recognizable signal on stock price charts. This simplicity will help you make quicker assessments.
- Predictability: When formed correctly, the evening star pattern has a relatively high success rate in predicting bearish reversals, especially when appearing near resistance levels or after extended uptrends. That way, you can anticipate downward stock price movements and potentially adjust your positions accordingly.
- Versatility: You can apply the evening star pattern to multiple time frames, from short-term intraday charts to long-term monthly charts. This versatility makes it adaptable to numerous trading styles and strategies.
Weaknesses
- False Signals: Like many technical indicators, the evening star candle pattern can produce false signals. Market conditions, news events, or other factors can impact stock price movements and disrupt the pattern’s accuracy.
- Dependence on Other Tools: You cannot predict stock price movements solely using the evening star pattern. Instead, you should combine it with other technical indicators, such as moving averages or volume analysis, to improve its reliability and reduce the risk of false signals.
- Subject to Interpretation: Interpreting the evening star candlestick pattern may vary among traders. The size of the candles, the definition of a Doji, and the strength of the bearish confirmation candle leave room for different analyses, leading to varied conclusions about the pattern’s significance.
Sharpen your Technical Analysis
The evening star candlestick pattern is a crucial guide for stock traders and analysts in decoding substantial price shifts. Through its distinctive three-candlestick formation, this bearish reversal pattern offers a clear visual narrative of shifting market sentiments.
By understanding the interplay of bullish and bearish forces this pattern showcases, you can make well-informed decisions and keep pace with the ever-shifting dynamics of stock markets.
That said, you should experiment with multiple strategies and indicators to find what works best for you. Moreover, remember that the evening star is not a foolproof indicator. Better combine it with other technical analysis tools like moving averages, indicators, and chart patterns to see a more holistic view of the market.
FAQ
1. What is the evening star pattern?
The evening star pattern is a stock price chart formation that suggests that the uptrend is losing steam, and a price decline is likely. A bearish candlestick pattern, it consists of three candles: an uptrend, a small-bodied candle signaling indecision, and a bearish candle confirming a potential trend reversal. Traders use it as a signal to sell or take a more defensive position.
2. How is the evening star pattern different from other patterns?
Firstly, the evening star pattern uses three candlesticks (there are pretty few), while most other patterns use one or two.
Secondly, each candle in the evening star pattern has specific size and position requirements, making it more objectively identifiable than open-ended patterns.
Lastly, given its complexity, the evening star pattern occurs less frequently than many other candlestick patterns.
3. What is the significance of the evening star for traders?
The evening star pattern signals a potential reversal from an uptrend to a downtrend. While less prevalent than other candlestick patterns, its specific requirements often result in a stronger, more reliable signal when it shows up on the trading chart. Even though the evening star pattern is not foolproof, it offers valuable support for identifying potential turning points, especially when used with other indicators.
4. Are there any variations or interpretations of the evening star?
The most common variation of the evening star is the Doji evening star pattern. In this candlestick pattern, the second component is a Doji candle, where the open, high, low, and close are almost equal. This underlines a strong sense of indecision before the reversal. On the contrary, the evening star pattern has a small-bodied second candle, indicating some indecision or a potential stall in the uptrend.
5. What is the reliability of the evening star in predictions?
The reliability of the evening star pattern depends on multiple factors, including the overall market sentiment, the strength of the trend, and confirmation from other technical indicators. While the evening star represents a bearish reversal, its effectiveness can vary. You must use it alongside other analysis tools for a more holistic and reliable view.
6. When is the evening star pattern most effective?
The evening star pattern is most effective when it appears after a sustained uptrend, indicating a potential trend reversal. Its reliability increases when accompanied by higher trading volumes and confirmation from other technical indicators, such as oscillators or trendlines. Traders find the evening star more compelling when it appears at significant resistance levels or aligns with broader market conditions, suggesting a sentiment shift.