Bullish Candlestick Patterns
Overview
Trading in the stock market is majorly based on technical analysis. This technical analysis comprises of different skills and attributes. Traders need a strong command or grip on chart analysis, trade theories, and price action to make the right move at the right time. In technical analysis, one of the major skills taught is analyzing candlestick charts and identifying the forming patterns.
Though there are numerous candlestick patterns, they have been categorized well. But, One of the most studied categories is the bullish candlestick patterns. This pattern of the candlestick indicates that the stock is going to see a positive uptrend as the buying pressure is increasing.
What are Bullish Candlestick Patterns?
In technical analysis, a lot of candlestick chart patterns are involved. One of them is the bullish candlestick patterns. This pattern forecasts the upward movement of stock. Though nothing can be guaranteed with any chart pattern, it just gives an idea or roadmap for the trading strategy. There are several bullish candlestick patterns that can be observed in charts, they all indicate different types of movement. One needs to have in-depth technical knowledge of charts to understand those patterns and predict the movement of stock. Here are the different bullish candlestick patterns:
1. Hammer:
Hammer pattern can be seen anywhere, but traders take advantage of it when it’s seen at the support zone. A hammer pattern is when the lower wick of the candle is longer than the body, representing the actual shape of the hammer. It represents the buying pressure, this further indicates that the downtrend is likely to end and the price of the stock may go up.
2. Inverted Hammer:
This is similar to the actual hammer pattern, the only difference it has is, it has a longer upper wick and a very short or no lower wick. Earlier, this pattern was used in the resistance zone, and selling pressure was increased for the stock. As time passed, the pattern has undergone several modifications. Traders have also started to use an inverted hammer in the support zone. This pattern represents another bullish movement in the stock. It is formed when buying pressure created by bears has failed to drag down the price of the stock. Thus, indicating an upward trend in the stock price.
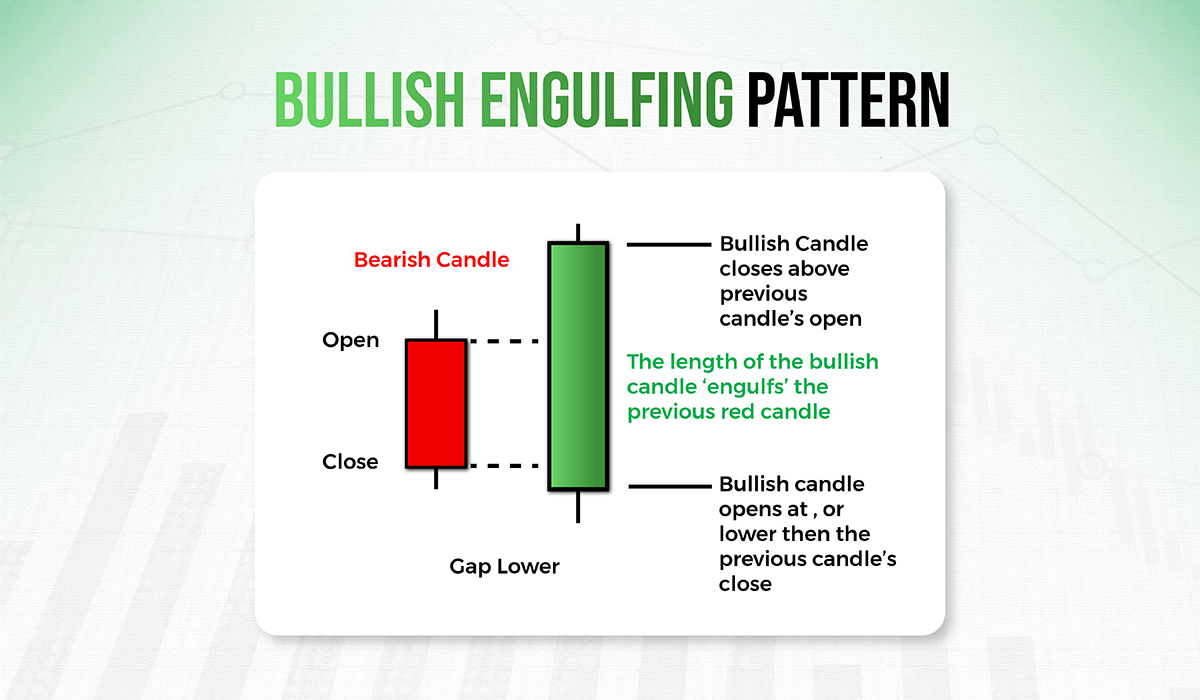
3. Bullish Engulfing:
It is one of the most prominent bullish candlestick patterns in technical analysis. It is formed when the green candle totally engulfs or covers the previous red candle from top to bottom. Usually, it is seen after consecutive red candles, and the formation of a bullish engulfing candle indicates the break in a downtrend and the start of a new uptrend. Traders take entry at this point which surges the buying pressure.
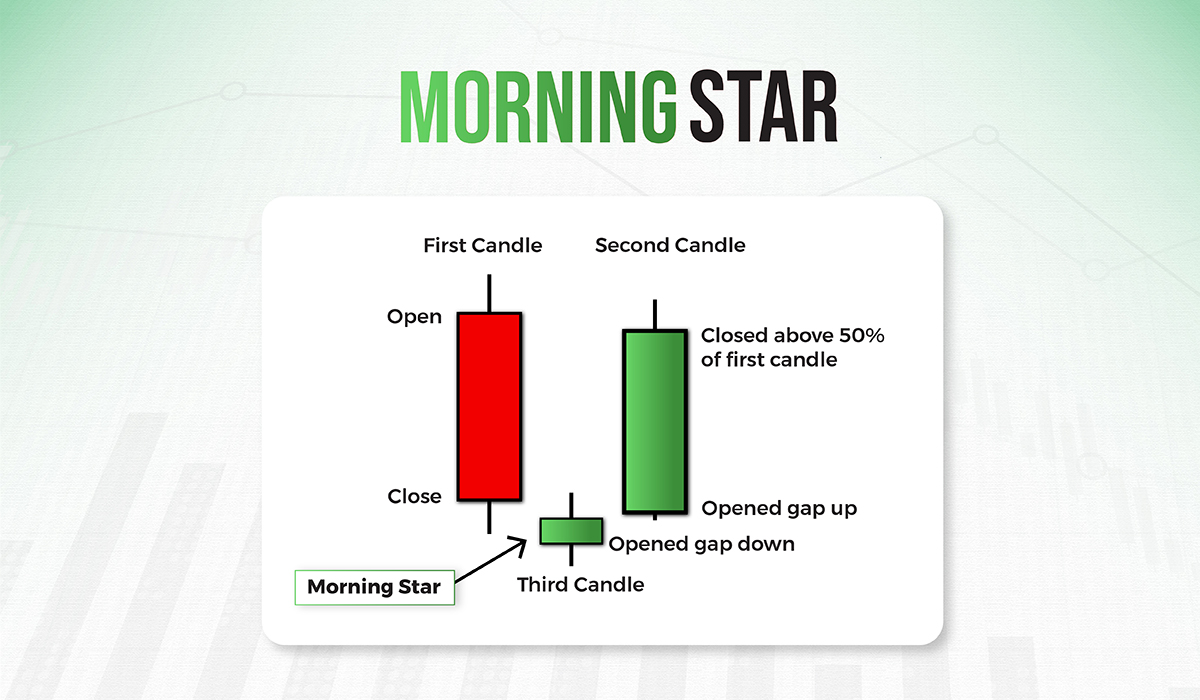
4. Morning Star:
This pattern comprises three candlesticks: a bearish candle, a base candle or doji, and a bullish candle. After consecutive red candles, when traders get indecisive about selling the stock, a doji or base candle is formed at the support zone. After, doji, a new green candle is formed that signals the start of an uptrend. Collectively, these three candles are called morning stars. It indicates a new rally and signals the start of an uptrend in the market. Traders usually take entry in the trade when this pattern appears at the support zone.
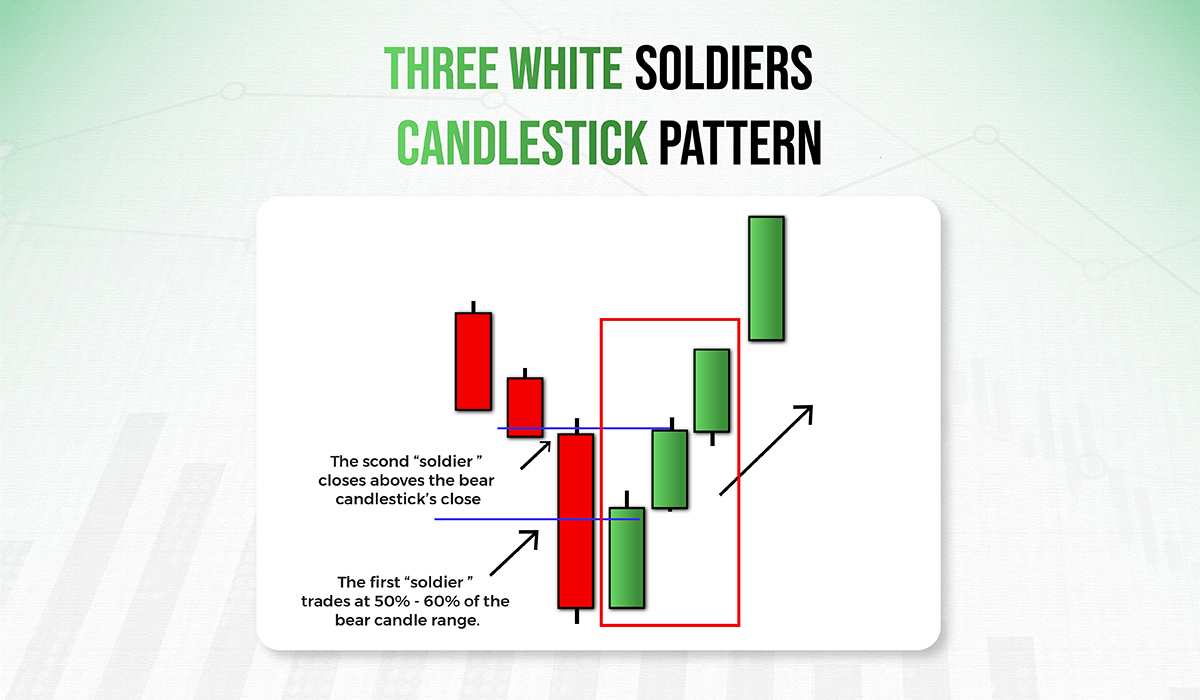
5. Three White Soldiers:
One of the most prevalent and easiest bullish candlestick patterns to understand is three white soldiers. A rally of three consecutive green candles can be seen in this pattern, this indicates the uptrend in the stock. These green candles do not have long wicks, instead have a long body indicating positive buying behavior. After moving from the support zone, the formation of three white soldiers can increase the probability of successful trade.
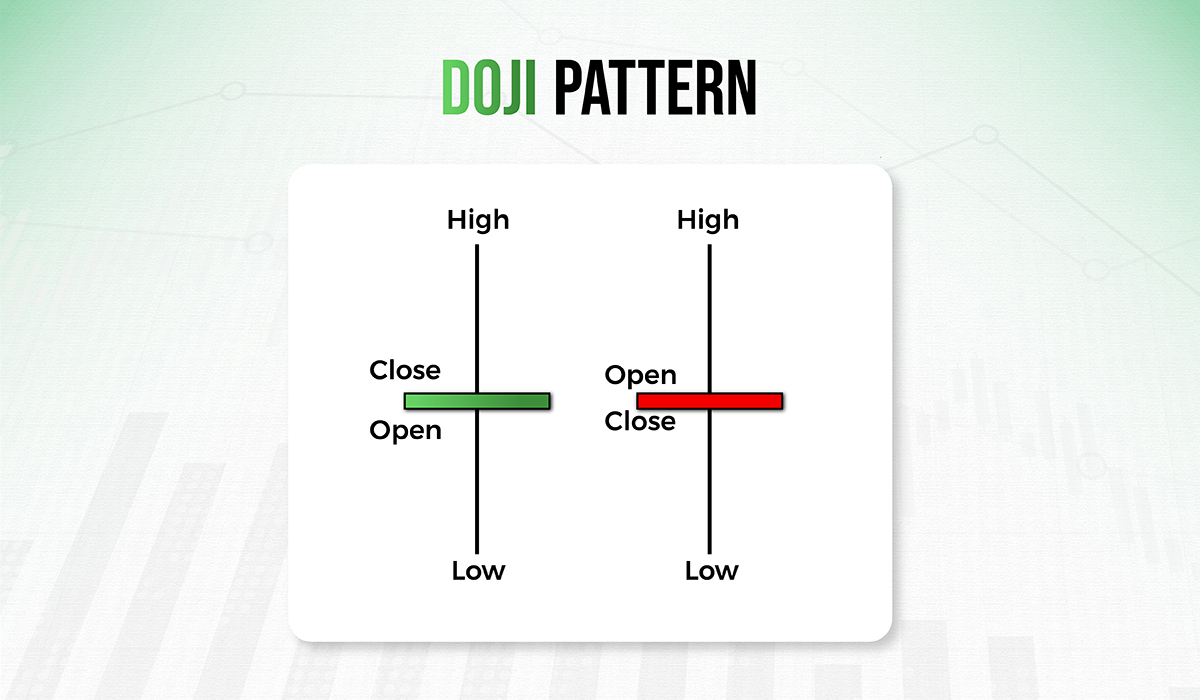
6. Doji:
This pattern of candlesticks has long wicks on both sides and a very small body, indicating the nominal difference between the opening and closing price. A Doji candlestick is a price action pattern that can be found both on support and resistance zones and traded respectively. When this pattern is formed in an uptrend, then the buyers are getting indecisive about selling the stock, thus indicating a reverse trend. Whereas, the opposite can be experienced in a downtrend. Whereas, the Doji pattern is less significant in non-trending markets as it creates indecision for the traders, as markets are not certain during these times time.
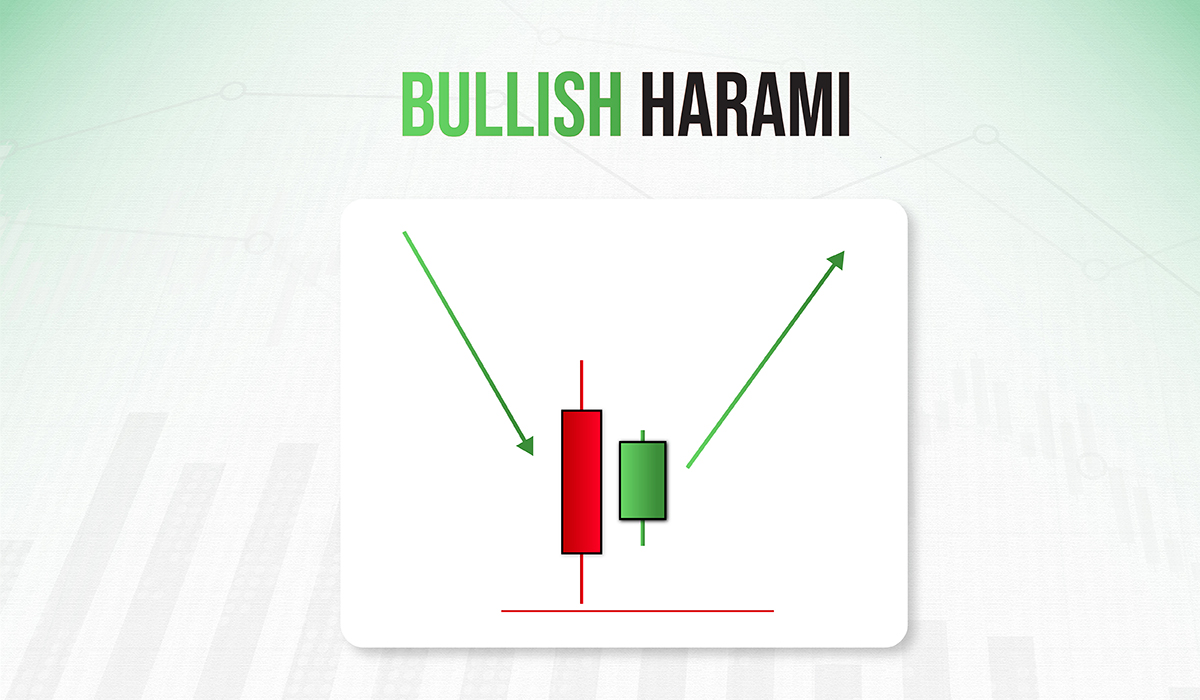
7. Bullish Harami:
It is a candlestick pattern that indicates a reversal of a bearish trend. A green candle is formed after a downtrend. This green candle is smaller than the previous red candle, indicating the reversal trend in the stock movement. Traders take advantage of this bullish candlestick patterns and take entry into the trade, as the price is forecasted to go up after this pattern.
Bottom Line
Candlestick patterns are far more advanced and reliable than the other types of charts in the stock market. The technical analysis of trading is based on candlestick patterns, they showcase the market sentiments along with the price movement. This greatly helps in predicting the further movements of the stock. The bullish candlestick patterns act as signals for traders. They significantly help traders in predicting an uptrend in the stock price. Though, a trader should thoroughly learn about technical analysis from experts to excel in trading.