Understanding Trendlines: Basics and Beyond
Overview
Trendlines — one of the favorite and most commonly used tools by traders. It allows users to explore market trends and psychology in many ways across different time frames. But how to read a trendline, why are they important, how to use it in investing, and are they a reliable tool? Well! We know there are so many unanswered questions. Therefore, we have loaded this blog with all the answers using plenty of examples. So stay tuned till the end.
What is Trendline
Let’s start at the beginning. Consider it like a map for traders, suggesting the direction of the price movement. It’s a straight line that connects the dots on a price chart. These dots represent the highs and lows of an asset’s price over a specific time period. By drawing a trendline, you’re essentially connecting the peaks or valleys of an asset’s price movement. This line helps you spot trends – whether an asset’s price is going up (bullish) or down (bearish).
In Brief:
- Trendline is a charting tool that shows the current direction of stock price.
- It helps identify a visual pattern of support and resistance levels in any time frame.
- Trendline is a diagonal line on the chart used to get a clear visual of market trends and detect potential reversal points.
- Traders can select their own timeframes and points to connect when they make a trendline. It’s kind of a “you do you” situation.
Types of Trendlines
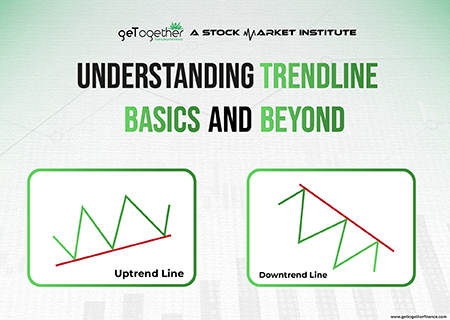
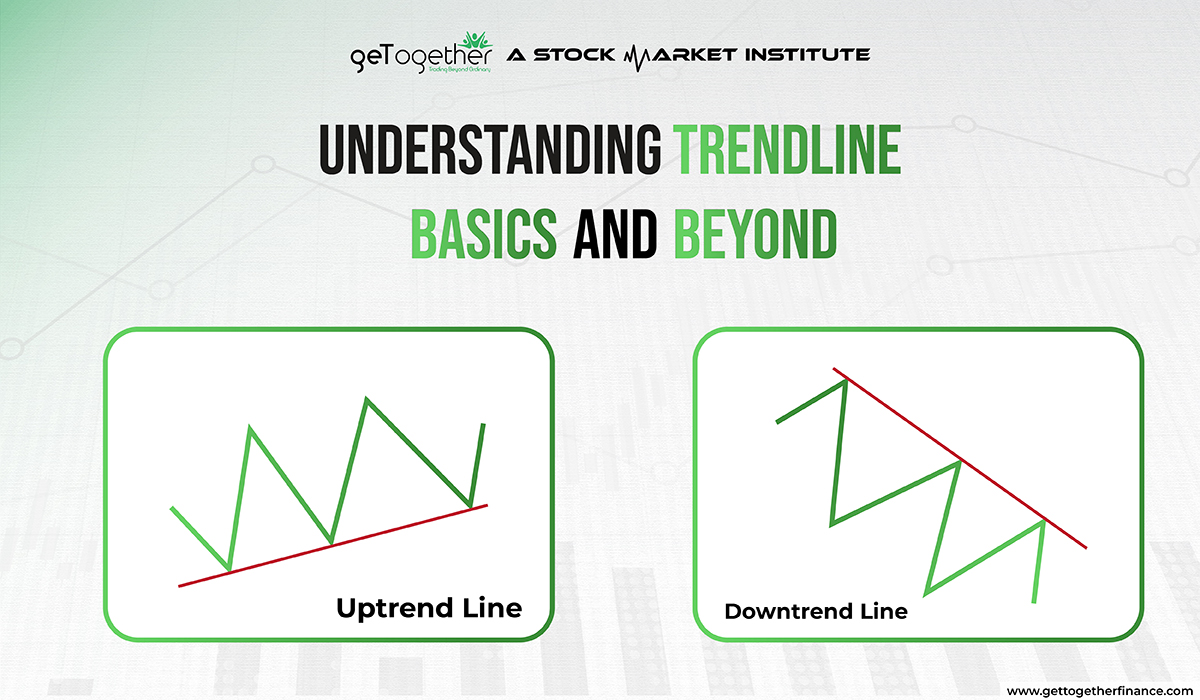
After understanding the basic definition of trendline, it’s time to explore its types. We have two key players in the game – uptrend line and down trend line. Let’s roll more details in this subject:
What is a Uptrend Line:

Imagine this as a way to a mountain top. An uptrend line connects the lows of an asset’s price, showing that it’s climbing over time. It’s a positive slope that requires at least two to three low points to verify the validity of the trend line. In simple terms, if the stock price drops and recovers with rallies multiple times, traders can easily draw the uptrend line via connecting the dots of their lows. Remember – the second low must be higher than the first to show the positive impact.
Note: If the price stays above the trendline, it is considered as uptrend. It acts as support in the demand of stock and shows a bullish attitude in the stock price. Although history is evident of several fake outs, it is essential to ensure before making a confirmed interpretation on the basis of trendlines.
What is a Downtrend Line:

On the other side, a downtrend line is like slanting into a valley. In this, the line connects the highs of an asset’s price, showing a downward trend. If a stock’s price is consistently dropping, merging the high points on the chart creates a downtrend line. Simplifying, if the stock price rallies and drops multiple times while creating consistent high points, traders can detect the downtrend line, drawing those high points.
Important Note: Downtrend line acts as resistance and demonstrates decline in the stock price. It shows a bearish attitude and increasing number of sellers. If the price remains under the line, it means the downtrend is robust. However, a break above the line shows that numbers of sellers are decreasing and change can be reversed.
Reading a Trendline:
Reading a trendline is as easy as connecting the dots. When you look at a trendline on a chart, it’s like following a road and it has a story to tell. An uptrend line tells traders that the price of an asset is going up, indicating a bullish trend. Conversely, a downtrend line speaks of drop in price, signaling a bearish trend. Understanding these lines allows you to anticipate future price movements.
How Do You Validate a Trend Line?
Consider them as clues in a detective story. You have to validate your proofs to make sure that you are right on the track and save yourself from the trouble of starting over. It simply means to always check if the price follows the trendline’s path. For example – in an uptrend line, ensure that lows consistently rise. On the other hand, see if the highs are consistently falling in a downtrend. Well! If the price behaves as expected, you’ve got a valid trendline.
Trendlines v/s Channels
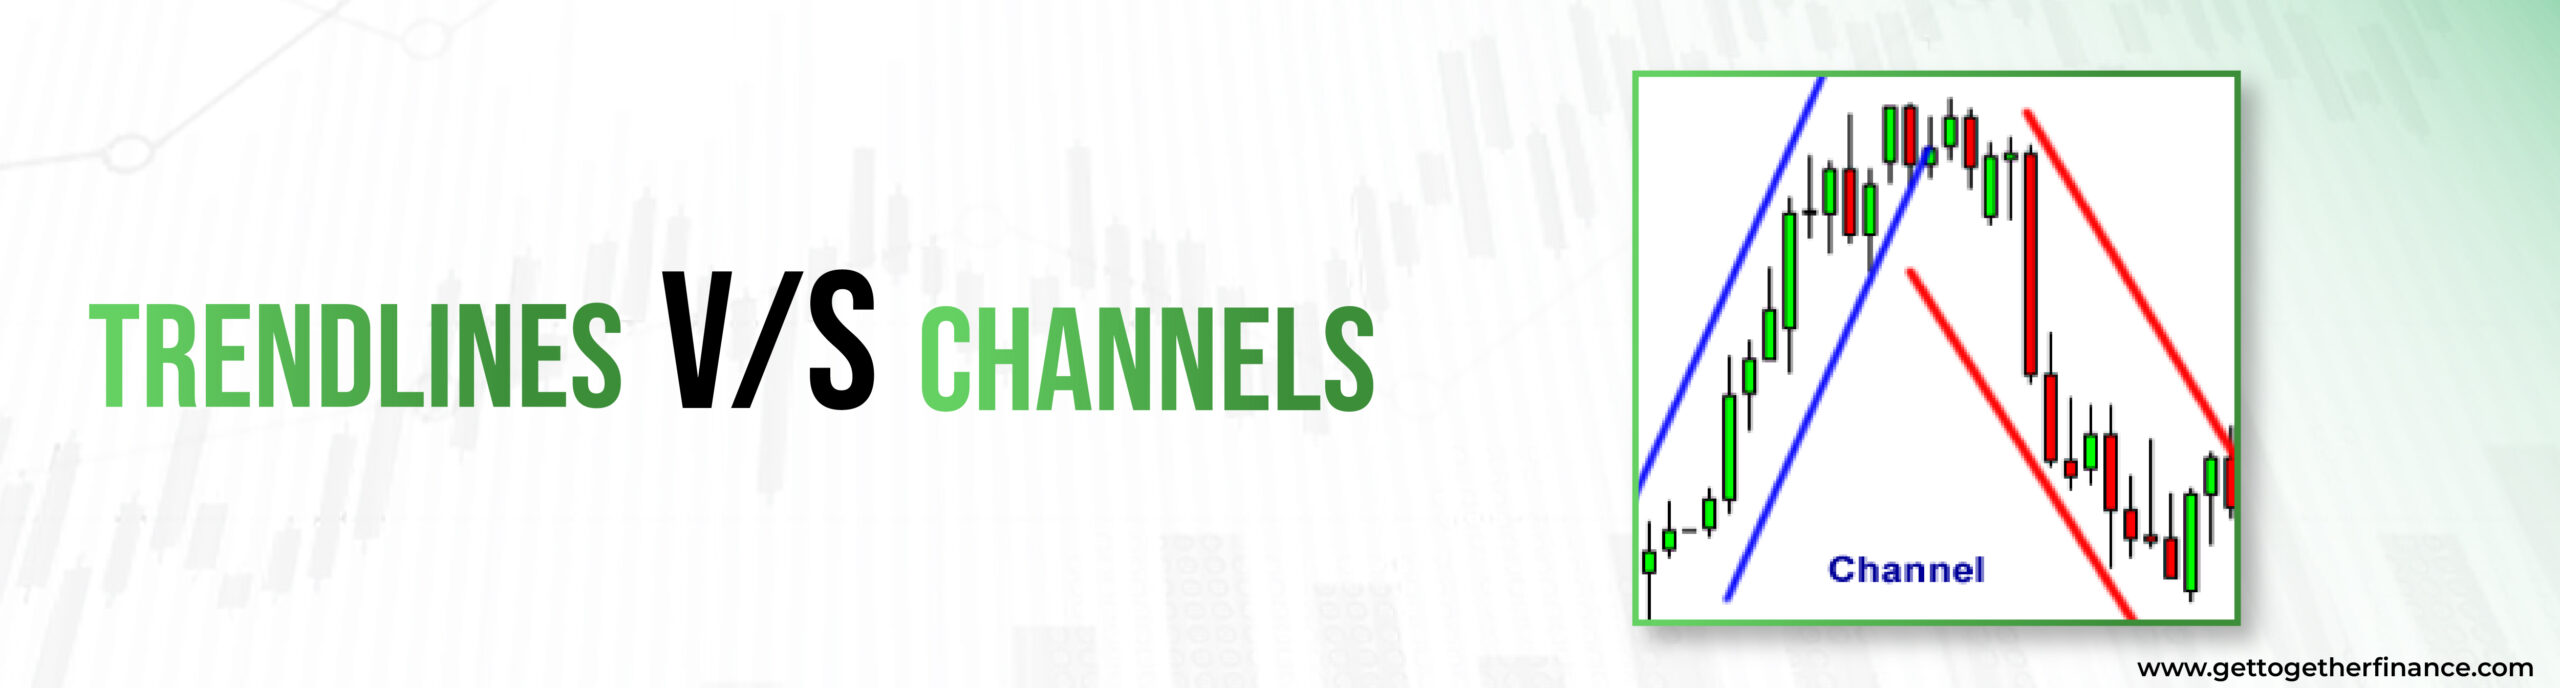
Although both of these terms sound similar, there is a fine line between channels and trendlines. they both are like cousins of. Channels are created by two parallel lines drawn as support and resistance, showcasing a price range. While trendlines are single lines, connecting the dots (price) to represent the trend direction. Let’s dig deep into both concepts:
| Aspect | Trendlines | Channels |
| What are they? | Lines connecting price points to show trends. | Two parallel lines outlining the price range. |
| Usage | Indicate trend direction. | Reveal price range or consolidation. |
| Reading | Single line showing trend. | Two lines create a channel. |
| Interpretation | Price likely follows the line. | Prices typically move between lines. |
| Direction | May be sloping up (uptrend) or down (downtrend). | Prices contained within the channel. |
| Support/Resistance | Potential support or resistance. | Upper line resistance, lower line support. |
Limitations
As much as we love trendlines, they’re not foolproof. One of the key limitations is that they may not predict the future accurately. Market is highly dynamic and can change in a flash, and trend lines might not always keep up. Moreover, when prices get too volatile, they can become less reliable.
We at GTF believe that, “trend is our friend” but only if you complement it with demand-supply theory (or your own research). You can back up your research with the trendlines, but if you’re completely relying on it – without support research – it can bite you back. History is evident that trend lines can be deceiving and should always be considered following your own findings. Remember, they’re useful tools, but not crystal balls.
Fakeout Breakouts : The Caution
Like a prank, it occurs when the asset price rises above breaking all the resistance levels, but for temporarily. This creates a perfect illusion of a significant breakout, but then it quickly recovers and reverses below that level. It’s akin to thinking you’ve struck gold, only to find fool’s gold instead.
Note: Almost every trendline on the chart shows the signs of fake breakouts. To avoid such situations, ensure to connect as many high or low points as possible or apply other indicators such as Demand-Supply, or RSI.
It’s A Wrap
Trendlines are the roadmap to understanding market trends, which come in two main flavors: uptrend and downtrend lines. These lines help you spot bullish and bearish trends. Just keep in mind that, while trendlines are handy, they aren’t magic. They provide valuable information, but you should always consider it as your back-up data to support your primary theory. GTF traders use trendlines to add more accuracy in their demand-supply theory.
FAQs
What are trendlines used for in trading?
It help traders identify the direction of an asset’s price movement, whether it’s going up (uptrend) or down (downtrend). Trendiness is like your trusty guides which help us figure out the direction of price movement. One can use it to spot potential buy or sell points, or to detect resistance and support levels. But remember to depend on it completely
Can trendlines predict the future?
Not really! While trendlines are helpful, there is no tool or person who can guarantee future price movements. Market conditions can change unexpectedly, and it is not wise to rely on one specific tool, insider tip, or technique completely. Hence, as expert traders say, trends can be your friend but keep your own research as your first priority.
Are there other tools to use with trendlines?
Absolutely! Traders often use other technical analysis tools and indicators in combination with trendlines to make well-informed trading decisions. There is a list of tools you can use along with it to validate your research, including moving averages, support and resistance, Relative Strength Index (RSI), candlestick patterns, volume analysis, chart patterns, Fibonacci Retracement, and demand and supply theory.
Why are trend lines significant in technical analysis?
They are a big deal in technical analysis. They help us see where prices are headed, acting as support or resistance, and let us know when to buy or sell. They’re like our secret weapon for making smart trading decisions and staying ahead in the market game. So, yeah, you can say, trendlines are pretty significant. But it is recommended by expert traders to use trendlines as a back-up to validate your own finding and not rely on it completely.
What should a trader do when a trendline breaks?
When a trend line breaks, traders should watch out for a potential trend reversal. If the trend line that was acting as support is broken, it may indicate a shift from an uptrend to a downtrend. Reversely, if the trend line which was acting as resistance breaks the pattern, it could indicate a change from a downtrend to an uptrend. Traders should be cautious, use other indicators, and consider their trading strategy accordingly.
How to use a trendline to identify the direction of a trend?
It is very simple to identify a trend using them. Here is the process you can use for simplifying the process:
Draw the Line: You can start by drawing a trendline on the price chart.
Analyze the Slope: Later check the direction of the line’s slope.
1.Upward slope indicates an uptrend.
2.Downward slope suggests a downtrend.
Price Behavior: Next, closely observe how prices interact with the trendline.
1.In an uptrend, prices stay above the trendline, using it as support.
2.In a downtrend, prices remain below the trendline, treating it as resistance.
Confirmation: Lastly look for multiple touchpoints where prices respect the trendline to confirm the trend direction.
Remember to use trendlines alongside other technical indicators and your trading strategy for a more comprehensive analysis.
How does the angle of a trend line affect its validity?
The angle of a trendline makes a real difference, but remember exceptions are always there. If the line is almost straight up, just like a super steep mountain – it seems intense but might not last. Contrary, if it’s almost flat like a barely sloping mountain – the trendline in such cases is considered weak and indication of sideways movement. As per experts, the best trendiness is somewhere in the middle, like a sweet, manageable slope. It’s where the seat spot of a trend is hidden, ready to keep going.